
Dashboard
Use the hosted dashboard to find recurring OpenUI errors and inspect affected generations.
After production setup, open the Reliability dashboard to understand how generated interfaces behave across real requests.
Use the dashboard to answer three questions:
- How often does generation fail? Track the share of responses with OpenUI parsing, validation, or rendering errors.
- What fails repeatedly? Group failures by error kind to identify components, schemas, prompt rules, or model choices that need attention.
- Which generations were affected? Inspect the context attached to an event so the failure can be reproduced in development.
Reliability dashboard
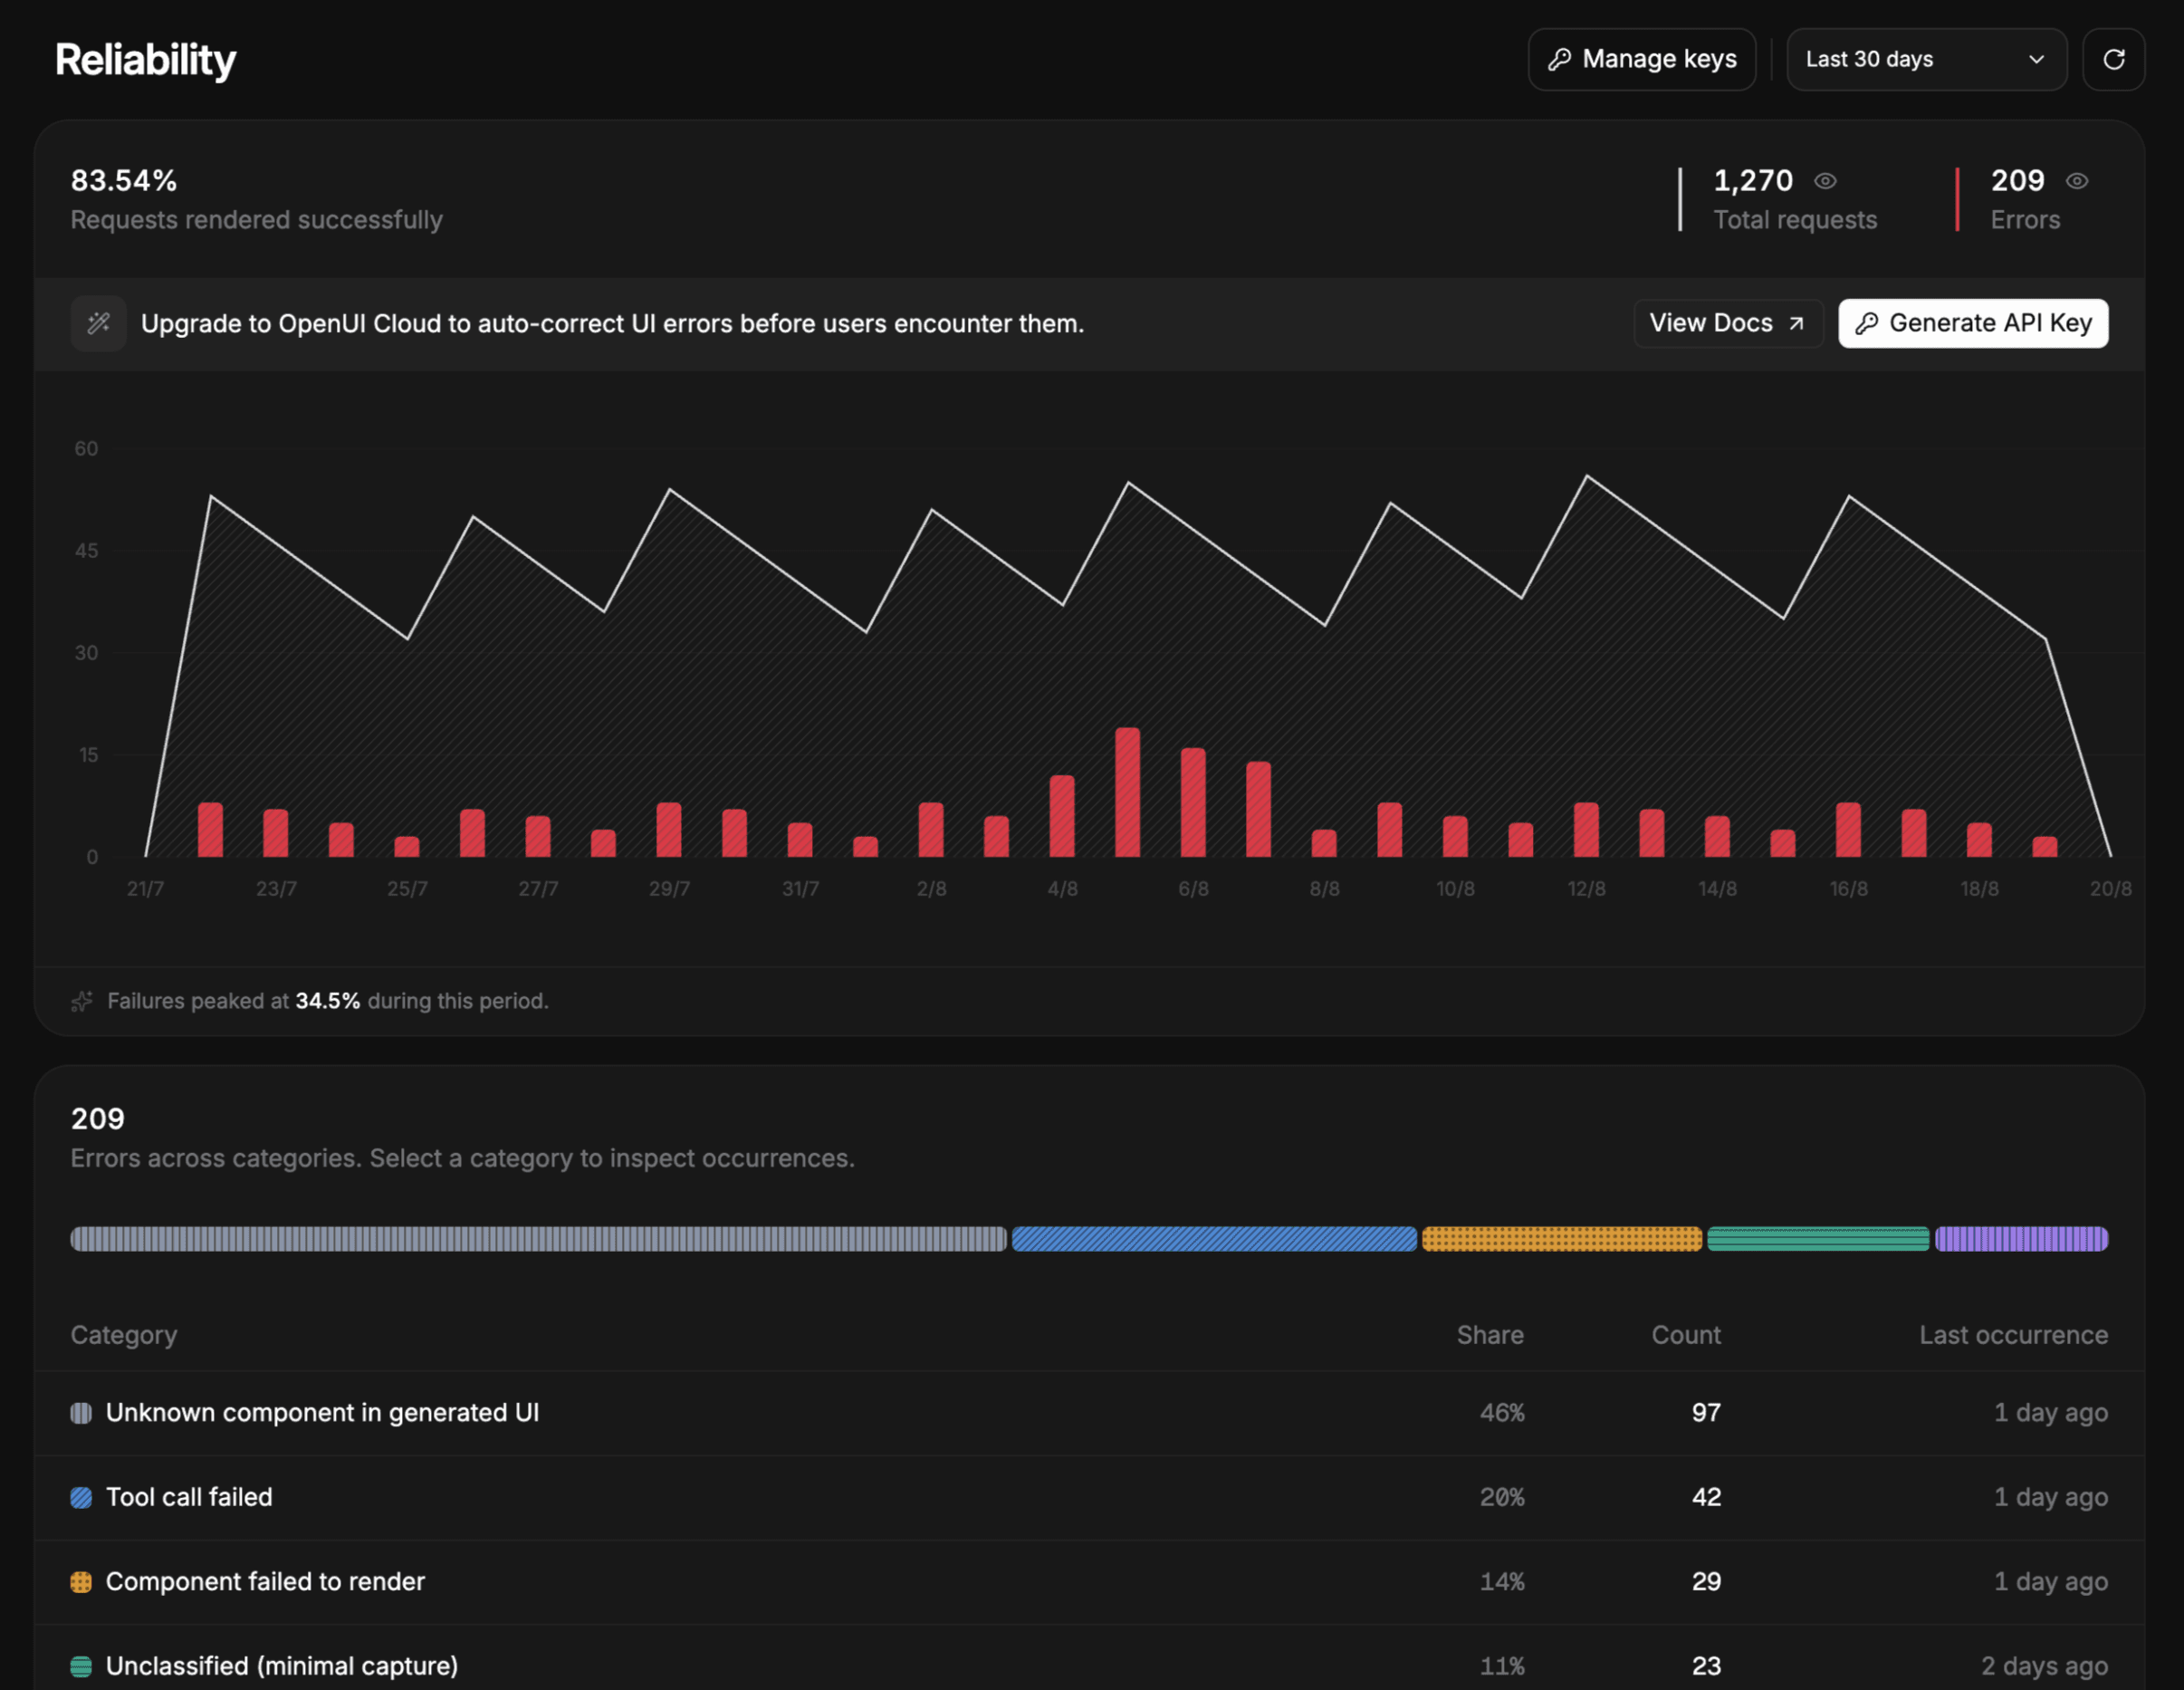
The dashboard summarizes the percentage of requests rendered successfully, the total number of requests, and the number of errors for the selected time period. The timeline shows when errors occurred, making spikes and changes in reliability easier to identify.
Errors are also grouped by category, with their share, count, and most recent occurrence. Use this breakdown to find the failure types affecting the most generations and decide what to investigate first.
Inspect an error category
Select an error category to open a sidebar with every occurrence in the chosen time range.
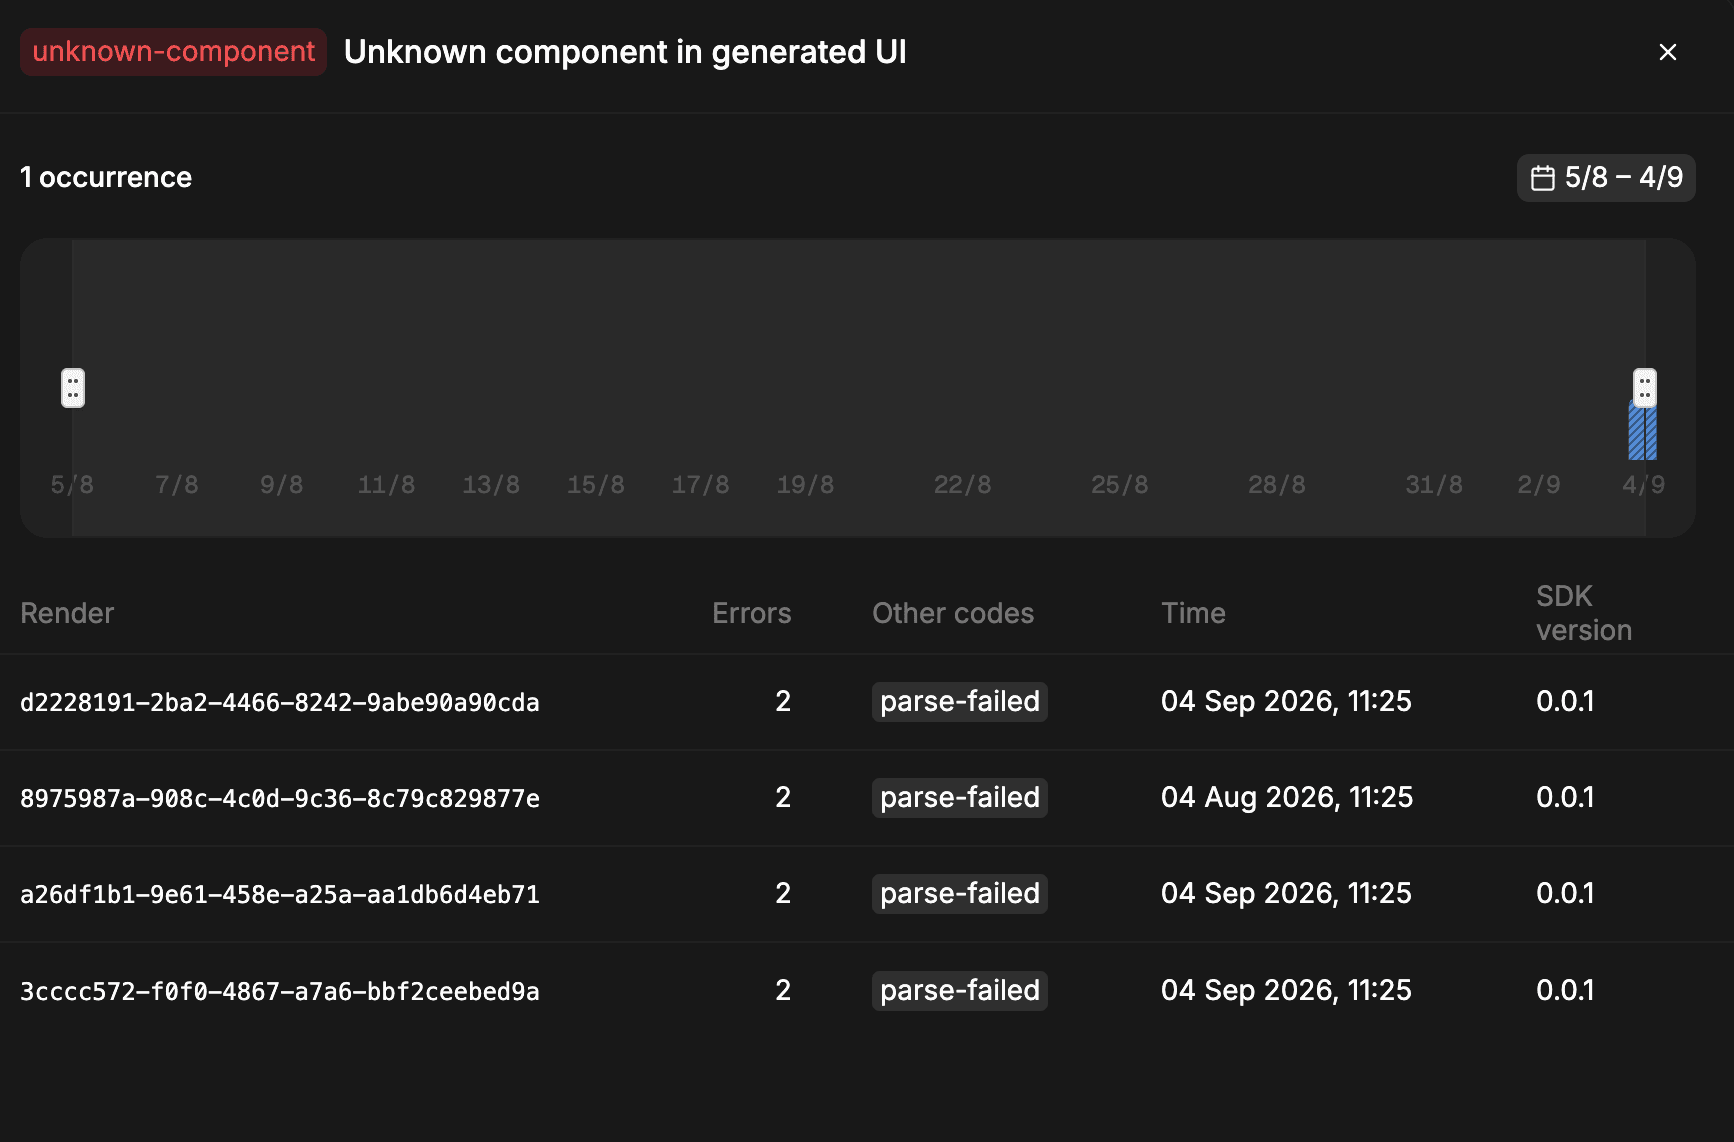
The timeline shows when the error occurred and helps reveal whether it is isolated or recurring. The list below identifies each affected render with the number of errors, related error codes, occurrence time. Use these details to narrow when the issue started occuring.
Inspect a single occurrence
Click on an error occurance to inspect the errors associated with a specific generated interface.
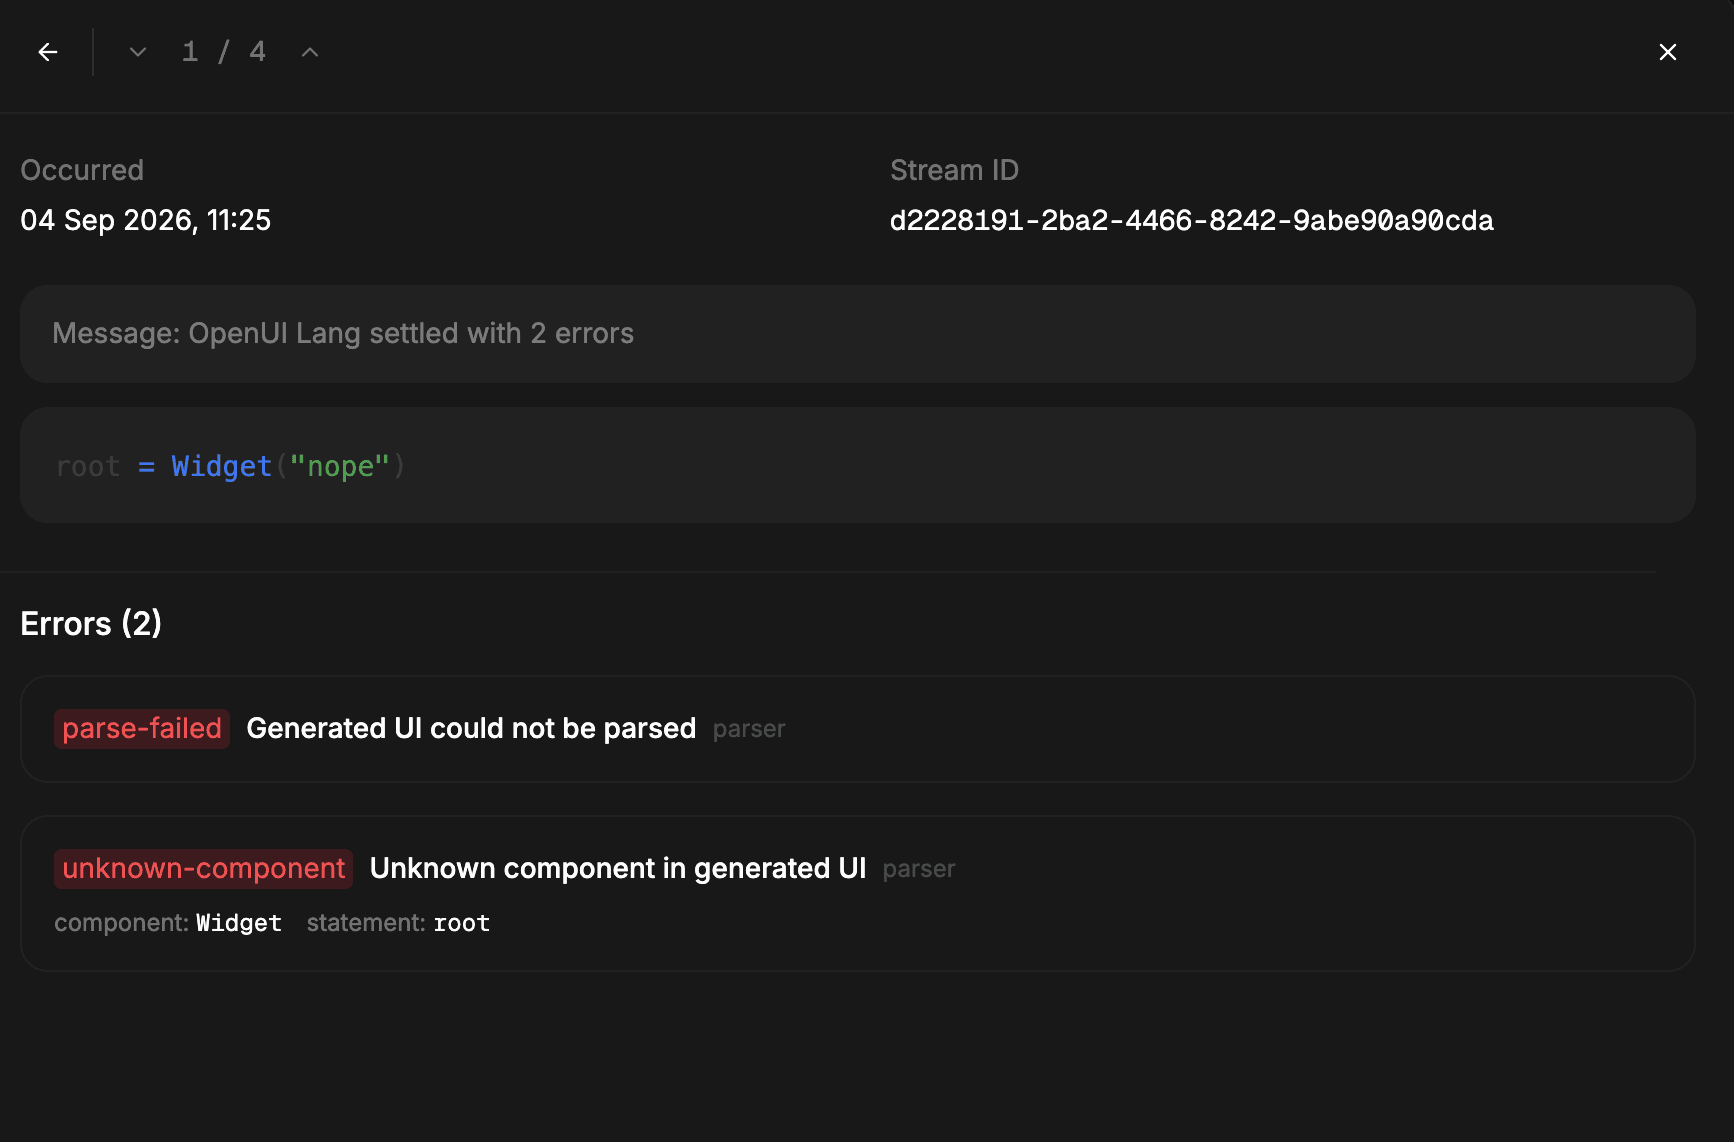
The detail view shows when the occurrence was recorded, and the generated OpenUI Lang that caused the failure. Each error includes a code, a readable explanation, and relevant details such as the component or statement involved.
See Optimizing with Observability for a repeatable improvement loop.