What are Claude Dashboards?
Claude Dashboards is a capability, launched in beta on October 8, 2026 alongside Claude Motion, that lets Claude answer a question about your data with a live dashboard (Anthropic announcement). You connect a data platform such as BigQuery, Databricks or Snowflake, or another connector such as Salesforce, and ask in plain language. Claude finds the data, builds the dashboard, and keeps it current as the data changes.
The observations in this article were made on claude.ai for the web on November 2 and 3, 2026, across three dashboards we had Claude build: one from pasted data, one on Google Sheets, and one on the deepwiki connector.
The problem a dashboard has to solve
A chat answer is written once, for one person, at one moment. A dashboard is not. It is opened again next week, by people who weren't in the chat, and its numbers are expected to be current every time.
The simplest way to build one is to have the model query the data and write a page with the numbers in it. For a one-off answer that is the right design: there is nothing to run afterwards, and it works with any data the model can reach. It stops working once the page has to last. Five requirements follow, and each maps to a part of the design:
- Fresh. Numbers typed into a page are a snapshot, out of date as soon as the data changes.
- Traceable. A number the model typed can't be checked against anything. A reader who doubts it has to ask the model again.
- Cheap to use. If every view or filter change goes back to the model, a dropdown costs a model call.
- Safe to share. Each reader has their own access to the data. A page that carries one person's results, or one person's credentials, leaks both.
- Known to work. The model writes the page but never sees it render in a reader's browser, so a broken chart can go unnoticed.
Claude Dashboards meet these by keeping the model out of the page at view time. Claude writes down where each number comes from and how to draw it, and a fixed runtime does the rest for each reader. The concepts below are the pieces of that design.
Concepts
Stored documents
A dashboard is a small tree of stored documents, keyed by path. Each document holds one part of the dashboard: its name, where its data comes from, its filter defaults, and the page that lays everything out and binds the data to it. Claude doesn't stream a UI. It writes these documents, and every later change is a change to one of them.
dash/meta
dash/params
datasets/<id>      one per data source
files/index.html
Datasets
A dataset never holds the numbers. It holds where they come from, so the numbers can be fetched fresh and traced back to a source. Each datasets/<id> document describes one source, and comes in one of two kinds.
A file points to a CSV, TSV or JSON file of up to 8 MB attached to the dashboard, for data with no connector behind it. The signups numbers were pasted into the chat, so this is the dataset Claude wrote:
{
  "title": "Weekly signups",
  "description": "Signups per week, by the Monday each week starts, from Sep 7 to Oct 26, 2026, as shared in chat.",
  "source": { "kind": "file", "url": "/_blob/4fd203ea…", "name": "weekly_signups.csv" }
}
A query is a saved tool call: a connector, one of its tools, and the arguments to call it with. If the same numbers lived in BigQuery, the dataset would look like this:
{
  "title": "Weekly signups",
  "description": "Signups per week, by the Monday each week starts.",
  "source": {
    "kind": "query",
    "connector": "BigQuery",
    "tool": "bigquery_query",
    "args": { "sql": "SELECT week_start, signups FROM `app.weekly_signups` ORDER BY week_start" }
  }
}
The title and description aren't used to load anything. They are what a reader sees in the Sources panel after clicking a number.
The page
files/index.html is plain HTML, CSS and JavaScript that Claude writes. What it leaves out matters more than what it contains: Claude never types a number into it. Every number on screen starts as a placeholder that names where its value comes from. This tile is from the signups dashboard:
<span class="ws-big dash-skeleton"
      data-draw="tile-signups" data-source="latest" data-field="signups">—</span>
data-source picks the source, data-field picks one column of it, and data-draw names the draw that writes the value. Here is the whole path for the tile, and for the chart beside it:
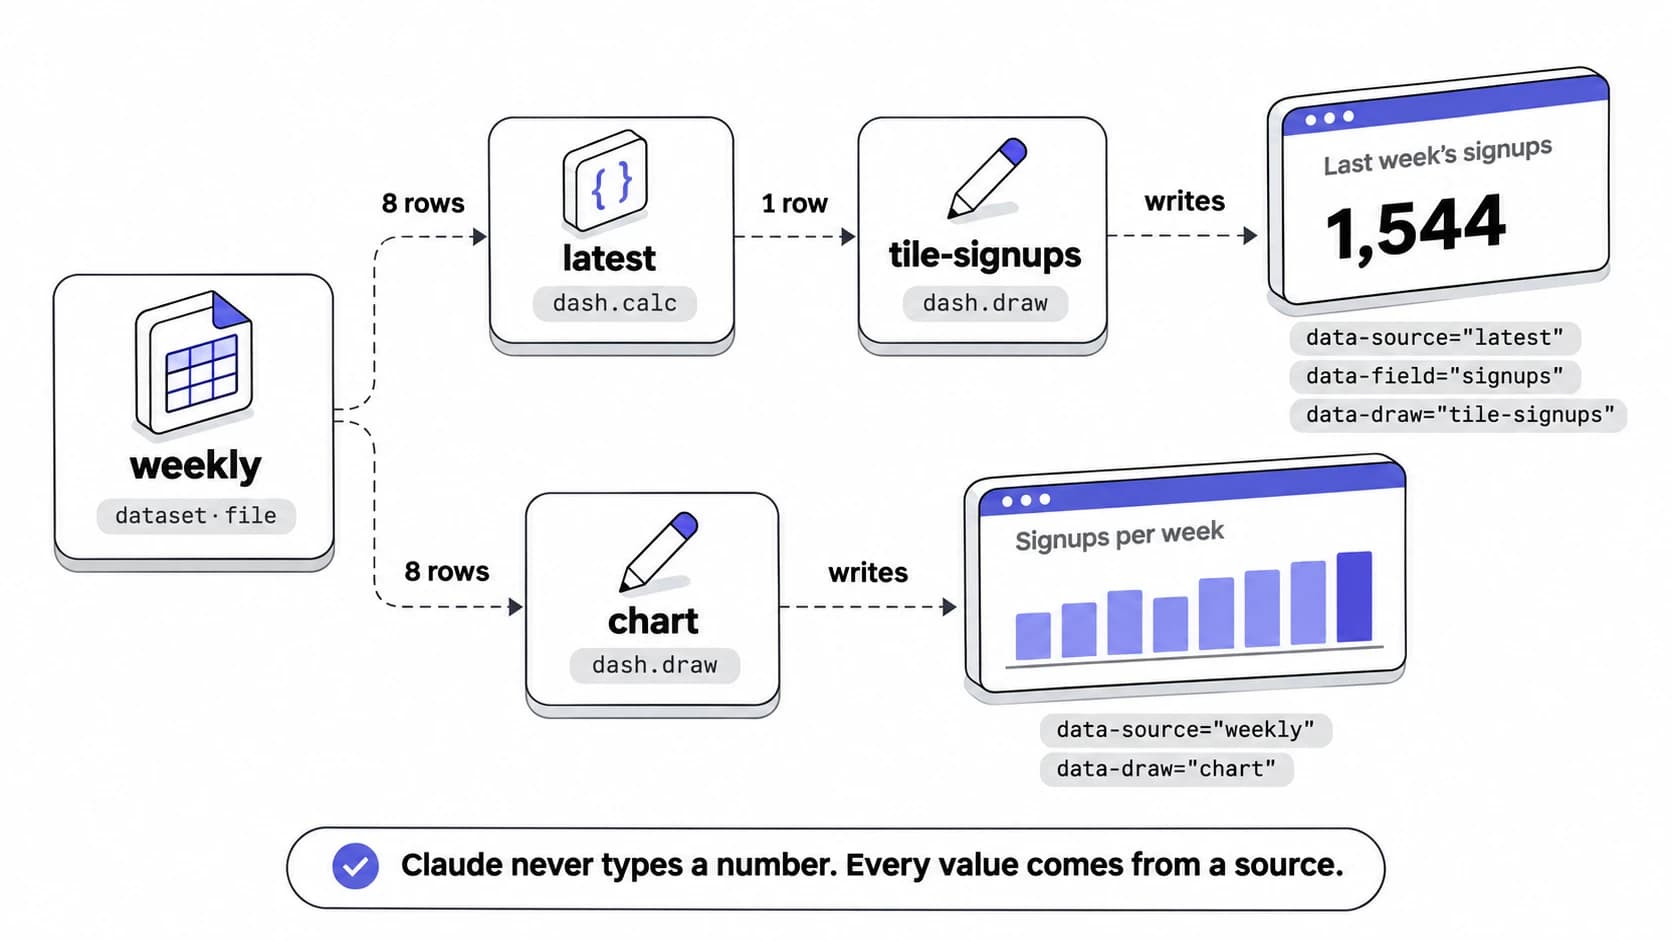
Until the draw runs, the reader sees a loading skeleton and a dash. Once it has, the span still carries its source and field. That is how the Sources panel knows where a clicked number came from, and how the verification loop can flag a number on screen that doesn't match its data.
There is no component library. Claude gets theme tokens, Anthropic's fonts and d3 (v7.9.0), and writes every tile, chart and table itself. The signups page is 12 to 14 KB. The Dashboard type's instructions tell Claude to stick to d3 ("No network, modules or React"). Even so, in another dashboard built in chat, Claude's page loaded Plotly from a CDN by adding the script from code.
The Dash runtime
A dataset returns raw rows, but a tile needs one formatted number. Something has to turn one into the other on every view, without the model. That is the Dash runtime: the dash object the viewer gives Claude's page. Claude declares functions on it, and the runtime decides when to run them.
A calc derives a new source from datasets or other calcs. The signups tile reads latest, a calc over the weekly dataset:
dash.calc('latest', {
  inputs: ['weekly'],
  title: 'Last week vs week before',
  fn: (weekly) => {
    const rows = weekly
      .map((r) => ({ week_start: String(r.week_start).slice(0, 10), signups: Number(r.signups) }))
      .sort((a, b) => (a.week_start < b.week_start ? -1 : 1));
    const cur = rows[rows.length - 1];
    const prev = rows[rows.length - 2];
    return [{ signups: cur.signups, change: cur.signups - prev.signups, /* … */ }];
  },
});
The calc converts the CSV's text cells to numbers, sorts the weeks, and returns one row comparing the last week with the one before it. That is the query work a SQL connector would do, written as JavaScript.
A draw doesn't return anything. It writes into its element: a single value for an element marked down to one cell, like the tile, or a whole chart for a container marked with only data-source, like the signups bar chart. It is registered under the name a placeholder gives in data-draw, and runs again whenever its data changes:
dash.draw('tile-signups', (el) => {
  const d = dash.data('latest');
  const row = d.status === 'ok' && d.data.length ? d.data[0] : null;
  el.textContent = row ? d3.format(',')(row.signups) : '—';
});
(Simplified: the page wraps this in a helper shared by all of its tiles, which also clears the loading skeleton and colours the change up or down.)
A loader turns a connector's answer into rows when it doesn't arrive as rows, such as a spreadsheet's grid of values or a plain-text list. The signups data needs no loader: the viewer already parses the CSV into rows.
Params
A reader who picks a different region or date range shouldn't have to wait for the model. Params are the dashboard's filter values, and changing one never involves Claude.
The signups dashboard we built has no filter. If it had one for how many weeks the chart shows, it would look like this. A default goes in dash/params:
{ "weeks": 8 }The page sets the param from a control, and the draw reads it:
<select class="ws-weeks" aria-label="Weeks shown">
  <option value="4">Last 4 weeks</option>
  <option value="8" selected>Last 8 weeks</option>
</select>
<script>
  const sel = document.querySelector('.ws-weeks');
  sel.addEventListener('change', () => dash.setParams({ weeks: Number(sel.value) }));

  dash.draw('chart', (el) => {
    const d = dash.data('weekly');
    const rows = d.status === 'ok' ? d.data.slice(-dash.params().weeks) : [];
    // … draw the bars for `rows` with d3
  });
</script>
Here nothing is fetched again. No query names weeks, so a change redraws at once from the rows the page already has (dash.resetParams returns to the defaults).
The other case is a param inside a query. A query can name a param as a {{name}} placeholder in its args. When that param changes, only the queries that name it run again, with the new value filled in as a single literal value. The rest of the dashboard stays as it is.
The viewer
Every dashboard needs the same machinery around Claude's page: loading data, showing when it was updated, refreshing it, explaining it. Claude doesn't write any of that. The viewer is Anthropic's prebuilt runtime, shipped with the Dashboard type (app.js, about 1.9 MB, plus its stylesheet), and it is the same code for every dashboard. It runs in the reader's browser, inside an iframe on its own origin, <dashboard-id>.frame.claudeusercontent.com.
The viewer reads the stored documents, cleans Claude's HTML, and runs its scripts with the Dash runtime passed in. Around the page it draws the toolbar ("Updated … ago", a refresh button, the Sources button), the Sources panel, and the verification loop.
The verification loop
Claude writes the page but never sees it render. The page runs in a reader's browser, with real data, at whatever width that reader's window is. So the open page checks itself and reports back.
After every change to the page, the viewer looks for script errors, NaN on screen, empty charts, overlapping or cut-off labels, and numbers that don't match the cell their marks name. It writes the result to a document of its own, data/users/<you>/check, which Claude reads with db_get. When Claude added a "Total signups" tile to the signups dashboard, with two patches to the page, the reader's open page caught the moment between them:
{ "v": 1, "status": "checking", "at": "2026-11-02T15:03:17.177Z" }
{ "v": 1, "status": "failed", "at": "2026-11-02T15:03:20.575Z",
  "page": [{ "kind": "drawing", "what": "no_function", "count": 4 }] }
The first patch had added the tile's four placeholders, and the second hadn't yet added the draws that fill them. Once it had, the check passed and the viewer deleted the document.
The Sources panel
A number on a dashboard is only useful if a reader can trust it without asking. The Sources panel answers "where did this come from?" for any marked number. Clicking a number opens its source, and the panel shows what produced it:
- A file or query dataset: its title and description, then the file, or the stored query's arguments with its connector and tool.
- A calc: its title, its inputs, and under Formula, the source code of its function as Claude wrote it.
- Result: the rows the source produced, with the clicked cell highlighted, and buttons to copy or download them.
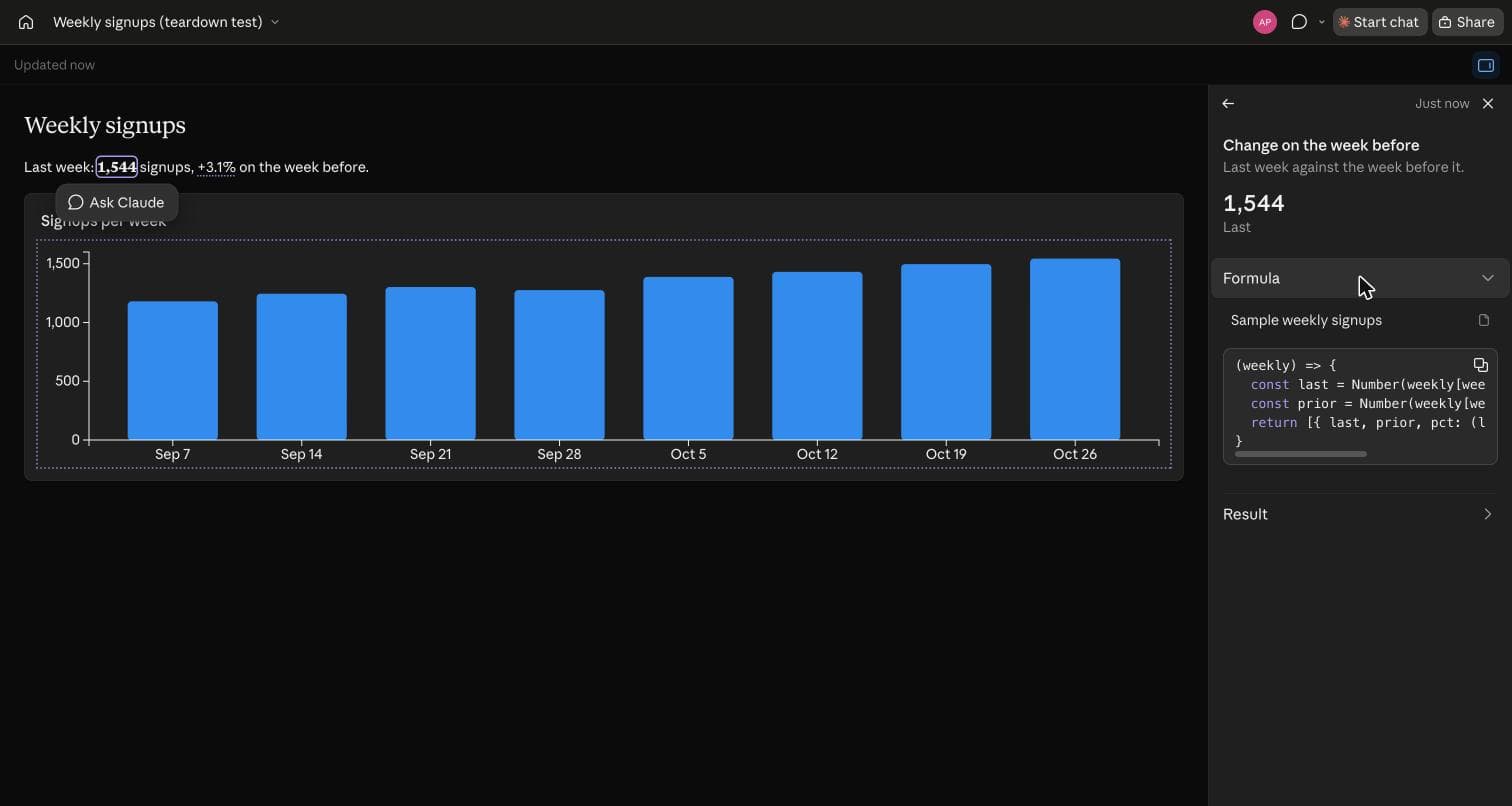
Draws never appear in Sources: they use sources and don't create them. That's why the marks on the page matter. They are what connects a number on screen to the dataset or calc that produced it.
Putting it together: build time and run time
The pieces split across two phases. At build time, Claude writes the documents in the chat. At run time, the viewer runs them in each reader's browser. The model works only at build time. Loading data, filters, clicks and refreshes all happen at run time, with no model call. The stored documents are the handoff between the two.
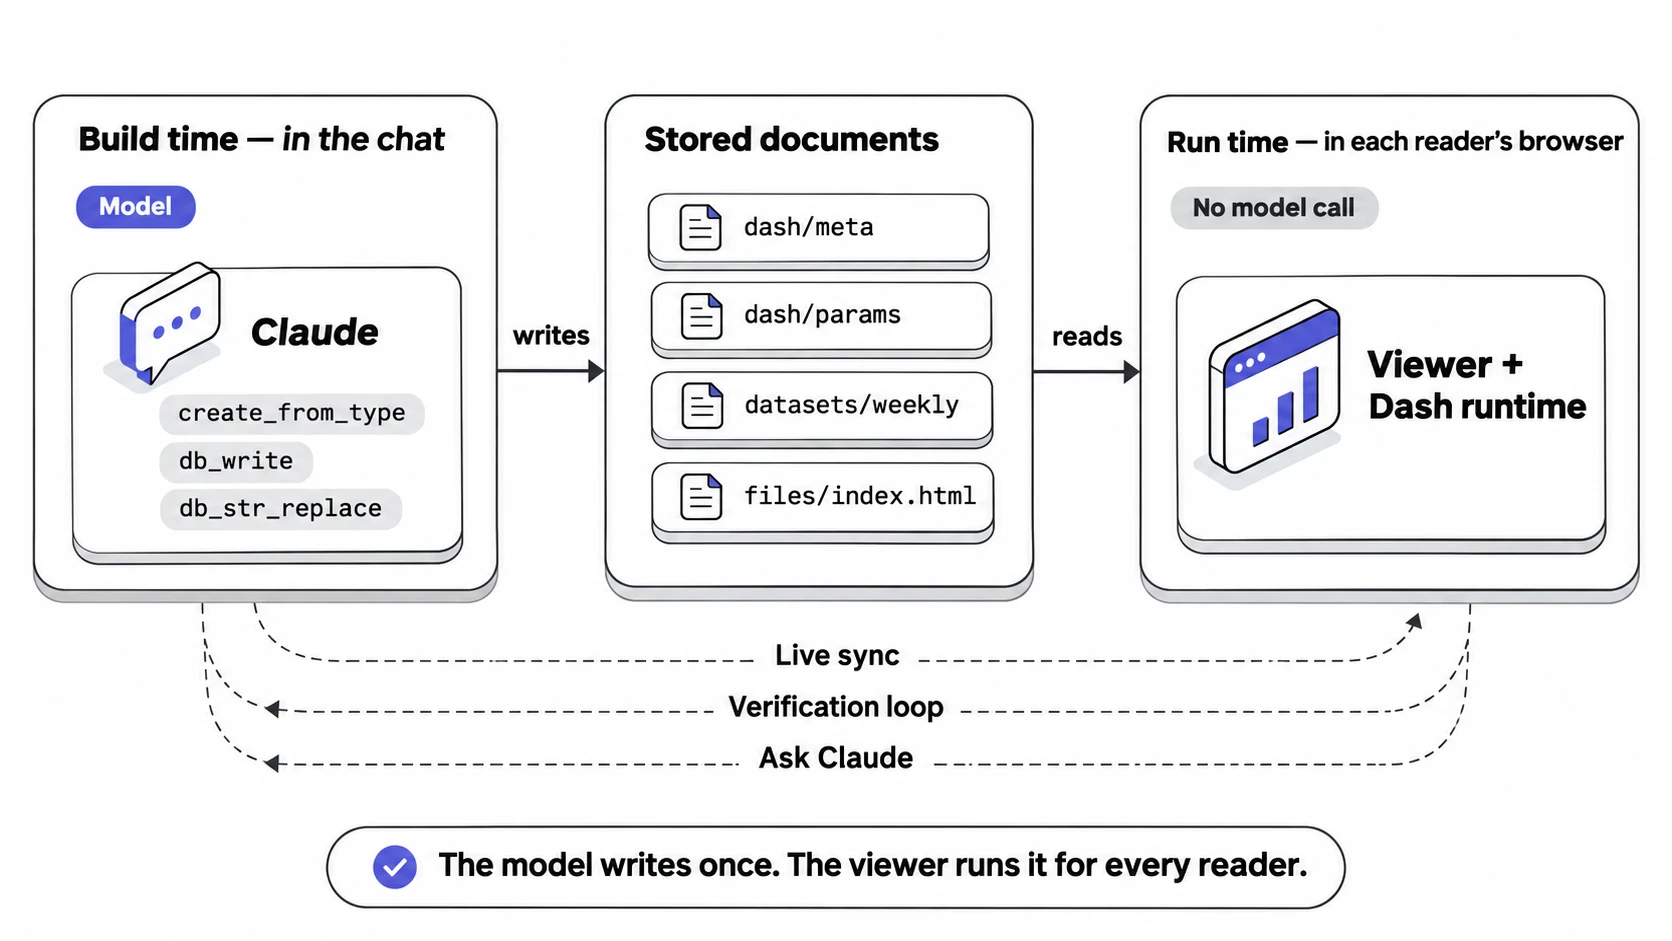
Build time: Claude writes the documents
The signups dashboard started from one message in a claude.ai chat:
Build me a dashboard of weekly signups from this data. Show last week's number, the change on the week before, and a bar chart per week. Data (week start, signups): 2026-09-07 1180, 2026-09-14 1245, …
Claude builds a dashboard with tools from a built-in connector, claude-artifacts, and each call appears in the chat (with approvals on, on an approval card). "Dashboard" is an artifact type on claude.ai: a template that ships the viewer along with written instructions for Claude.
Build time
The signups build, turn 1
- 0:00Reads the instructionslist_typesdescribe_typeThe Dashboard type's instructions, plus 2 of its 14 reference files.
- ~0:20Creates the dashboard and attaches the datacreate_from_typeupload_assetThe side panel opens, empty. The pasted numbers become a 147-byte CSV.
- Writes the page in its sandboxAbout a minute for 12 KB of HTML and JavaScript. Nothing renders yet.
- ~2:45Writes every document at oncedb_write3 documents, 13,226 bytes. The dashboard is on screen about 3 seconds after approval.
- Reads the checkdb_getLater edits, like the Total signups tile, are db_str_replace patches.
Times are approximate, from screenshots taken every 6 to 10 seconds.
Two steps need more than a line. When the data sits behind a connector, Claude first probes it. It calls the connector's tools itself, on the chat user's account, to learn which tools exist, whether the connector is signed in, what shape the answer takes, and which call returns the right data. It then saves the call that worked as a query dataset. The signups numbers were pasted into the chat, so there was nothing to probe, and Claude attached them as a file instead.
The other is editing. A db_str_replace patch is a find-and-replace on one field of one document. Each patch carries ifVersion, the version Claude last read, so it applies only if nobody has changed the document since.
Run time: the viewer runs them for each reader
When a reader opens the dashboard, the viewer loads the stored documents and works backwards from what the page needs to show:
- The viewer cleans the HTML and runs the page's scripts. The scripts only register calcs and draws; they compute nothing yet.
- The viewer runs each draw.
tile-signupsasks fordash.data('latest'). latestis a calc overweekly, so the viewer loadsweekly. For a file dataset, that means fetching/_blob/…from the dashboard's own origin and parsing the CSV into rows.- The viewer calls the calc's function with those rows and gets back one row for the latest week.
- The draw runs again, now with data, and writes "1,544" into the tile.
A query dataset changes only step 3. Instead of fetching a file, the viewer asks claude.ai to make the stored call. claude.ai runs it on the reader's own connector, from its servers, and hands back the answer.
The same chain runs whenever data changes: a refresh, a new file, a filter. The page never fetches or polls on its own.
Every visit makes the live call again. So that the page can draw at once, the reader's browser keeps each answer for 24 hours, keyed by account, dashboard and exact call (each set of filter values is its own entry). The page draws from that copy, shows "Refreshing…", and swaps in the live answer when it arrives. Errors, tools that aren't read-only, and answers over 16 MB aren't kept. The viewer's code also has refresh choices other than "On each visit" (after 5 minutes, an hour, a day or a week). They sit behind a feature flag and weren't shown on our account.
Security
A dashboard page is code a model wrote, running in every reader's browser, with a path to that reader's connectors. A bug, an instruction injected through the data, or another editor could all put bad code there. Each layer below starts from what could go wrong.
Sandboxing
A script served from claude.ai itself would run as the reader, with their session cookies, and could read their chats. Plain HTML could do damage too: a meta refresh to a fake sign-in page, or a <form> that posts what they type elsewhere.
Instead, the page runs on its own origin (<dashboard-id>.frame.claudeusercontent.com) in a sandboxed iframe. The viewer strips meta, form, iframe, on… attributes and similar from Claude's HTML, and runs the page's inline scripts itself. The frame's Content-Security-Policy blocks fetch, images, WebSockets and frames to outside hosts. A <script src> to an outside host is stripped. A script that page code adds can still load, but only from six CDNs.
Credential handling
A page holding the reader's Google token could copy it out, and the token would keep working outside the dashboard.
The page never holds credentials. It can only post messages to the claude.ai page around it, which makes each request with a short-lived token issued to that dashboard's frame. Connector calls run on claude.ai's servers with the reader's own access. No Google token or Bearer header appears anywhere in our captured traffic.
Access control
If anyone could edit the page, one reader could rewrite the code everyone else runs. If opening a link were enough, a page could call tools on your connectors without asking. Three rules prevent that:
- Editing. Only editors write the dashboard. A reader can write only their own check and run documents, which Claude is told to verify before trusting.
- Consent. Each reader grants each tool, per dashboard, on a card that names the tool.
- Sharing. A file travels with the link: anyone who can open the signups dashboard can read its CSV. Live data doesn't. A viewer from another account gets no connector access at all, even with the same connector of their own. People you invite, and teammates in your organisation, are treated differently. According to the viewer's code, the page can use their connectors too, and the per-tool consent card is the only thing that stops it. We couldn't test this: the share feature wasn't working when we ran our tests.
Permission boundary
The saved datasets look like the limit of what a dashboard can do. They aren't. Page code can call any tool on the reader's connectors through claude.use('mcp'). In our tests, each new tool brought up its own consent card and then ran. That includes write tools: the card doesn't say a tool writes, and a test write reached Google with no further prompt, even with the tool set to "Needs approval".
The read-only SQL check has the same gap. The viewer refuses a query dataset that isn't a single SELECT or WITH, but page code calling a tool directly skips that check. Our test DELETE reached claude.ai's broker and stopped only because no SQL connector was connected. Whether claude.ai's servers refuse it is untested.
The consent click is the real boundary.
Parting thoughts: Claude Dashboards and OpenUI
Claude Dashboards arrive at the same architecture as OpenUI Lang. The model writes the wiring once, at build time: which tool to call, how to shape the answer, and where each value goes. A runtime then executes that wiring for every reader, with no model call. Nearly every concept in this post has a direct counterpart:
| Claude Dashboards | OpenUI Lang | |
|---|---|---|
| Data binding | A dataset document: {connector, tool, args} | data = Query("tool", args, default, refreshSecs) in the program |
| Who runs it at view time | The viewer → claude.ai page → claude.ai backend → the reader's connector | The app's toolProvider in the browser: a function map that calls your API routes, or an MCP client |
| Credentials | claude.ai holds each reader's connector token | Your app's backend and auth; the browser calls your routes |
| Parameters | {{name}} filled in as one literal value; dash.setParams | $variables in args; the query runs again when they change |
| Refresh | Every visit, drawn first from a 24-hour copy in the reader's browser | 4th argument, in seconds |
| Derived values | Hand-written JS in a dash.calc | @ functions such as @Filter, @Sort and @Last, or your own |
| Data into UI | Hand-written JS: dash.data(id) inside dash.draw | data.rows.signups passed straight into components |
| Writes | No write step in the format; any tool the reader grants can write | Mutation(...) run with @Run |
| What the model's output can call | Any tool of the reader's connectors, each after the reader's consent | Only the tools in toolProvider |
| Read-only guard | SQL check in the viewer, for datasets only | Whatever your tools enforce |
| Building blocks | Tokens + d3; Claude writes the HTML | A component library, such as @openuidev/dashboard-library |
| Edits | db_str_replace patches to stored documents | Incremental editing: only the changed statements |
| Error feedback | The verification loop writes faults back for Claude | onError returns structured errors to send back to the model |
Here is the signups dashboard's core in OpenUI Lang, using components from the default OpenUI library and a weekly_signups tool your app provides:
$weeks = "8"
root = Stack([filter, chart])
filter = Select("weeks", [SelectItem("4", "Last 4 weeks"), SelectItem("8", "Last 8 weeks")], null, null, $weeks)
weekly = Query("weekly_signups", {weeks: $weeks}, {rows: []})
latest = @Last(@Sort(weekly.rows, "week_start"))
chart = BarChart(weekly.rows.week_start, [Series("Signups", weekly.rows.signups)])
A tile reads latest.signups. That is the latest calc, the weeks param and the chart draw, in six statements and with no page code.
Security is smaller
A Claude Dashboard runs JavaScript the model wrote, which is why it needs a sandbox, HTML cleaning and a Content-Security-Policy. OpenUI Lang runs no model-written code. The renderer draws only components from your library, and calls only built-in functions, the functions you registered, and your tools. Anything else is an error.
Authentication and authorization still need the same care. Your API routes must check who the user is and what each call may touch, and validate the arguments the model chose as you would any user input.
Methodology
We traced Claude Dashboards on claude.ai on November 2 and 3, 2026, across three dashboards Claude built in chat (signups from pasted data, a Google Sheets sample and deepwiki) and one test dashboard. Our sources were Claude's tool-call logs, the traffic between the dashboard, the claude.ai page and claude.ai's servers, the viewer's JavaScript, and the Dashboard type's instructions to Claude. We did not test signed-out readers, the flagged refresh settings, or the mobile and desktop apps. Sharing wasn't working for us at the time, so we couldn't properly test sharing workflows beyond opening a link from a second account.